
Fast betting is getting more attention across the betting industry.
Virtual sports can run throughout the day. In-play betting creates new markets while a match is happening. Traditional sports continue to bring large betting volumes.
I wanted to compare these areas using data rather than opinions.
For this project, I built a five-page Power BI dashboard using publicly available industry data. The dashboard looks at market size, virtual sports, in-play betting, traditional sports and regional iGaming data.
Here is what I found.
1. Market Overview
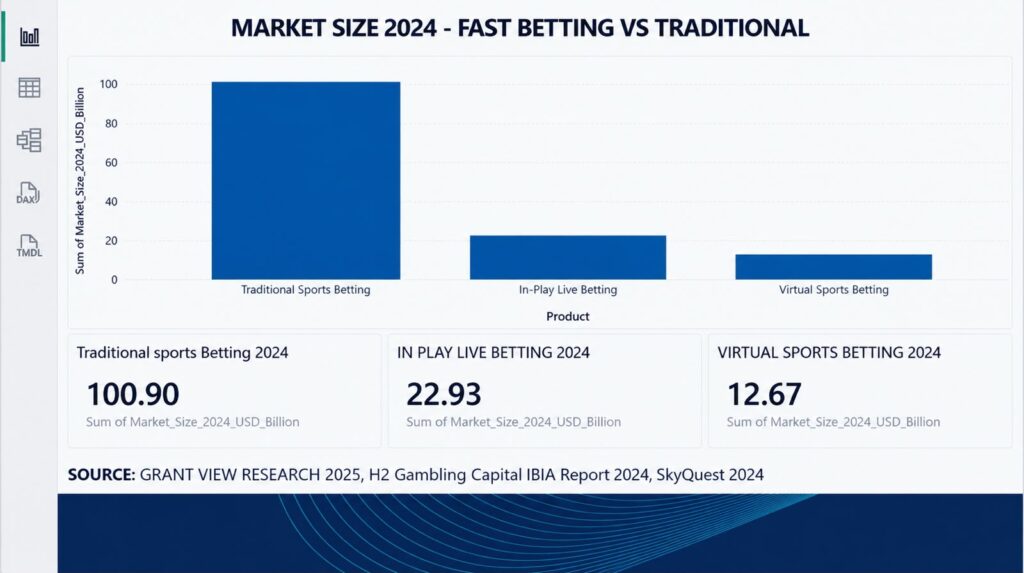
The first page compares the reported market sizes.
Traditional sports betting was estimated at $100.9 billion in 2024.
In-play betting was estimated at $22.93 billion.
Virtual sports betting was estimated at $12.67 billion.
Traditional sports is much larger than the other two categories.
Virtual sports is smaller, but the market reports used for this project show a higher expected growth rate.
These figures come from different research reports, so they should not be added together. Each figure represents a separate market estimate.
2. Virtual Sports
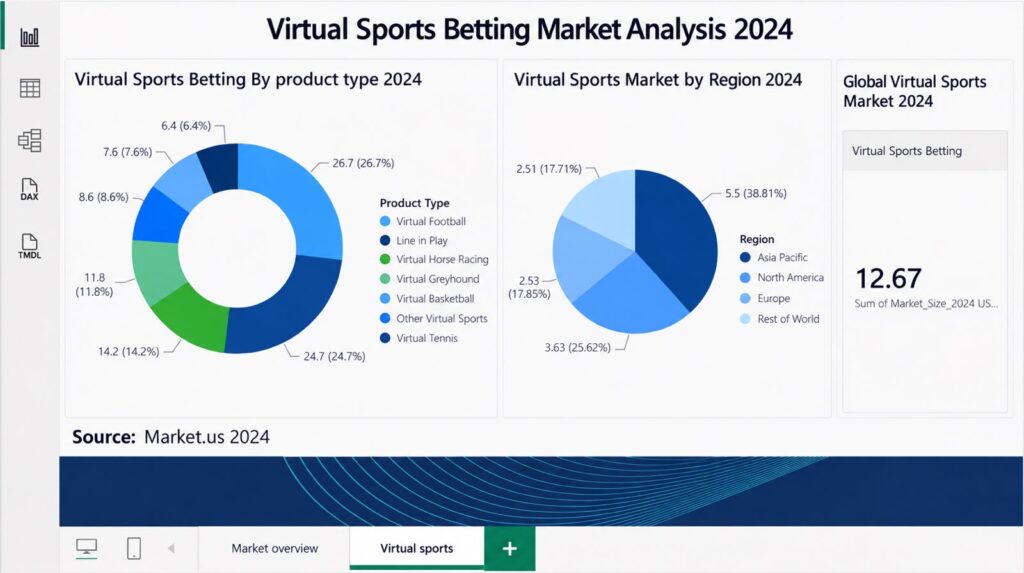
Virtual sports includes several different products.
The largest category in the data is virtual football at 26.7%.
Line-in-play accounts for 24.7%.
Virtual horse racing accounts for 14.2%.
Virtual greyhound racing accounts for 11.8%.
Virtual basketball accounts for 8.6%.
Virtual tennis accounts for 6.4%.
Other products make up the remaining 7.6%.
The regional data also shows a clear difference.
Asia Pacific represents 38.8% of the virtual sports market in the dataset used for this analysis.
3. In-Play Betting
The next part of the dashboard looks at in-play betting.
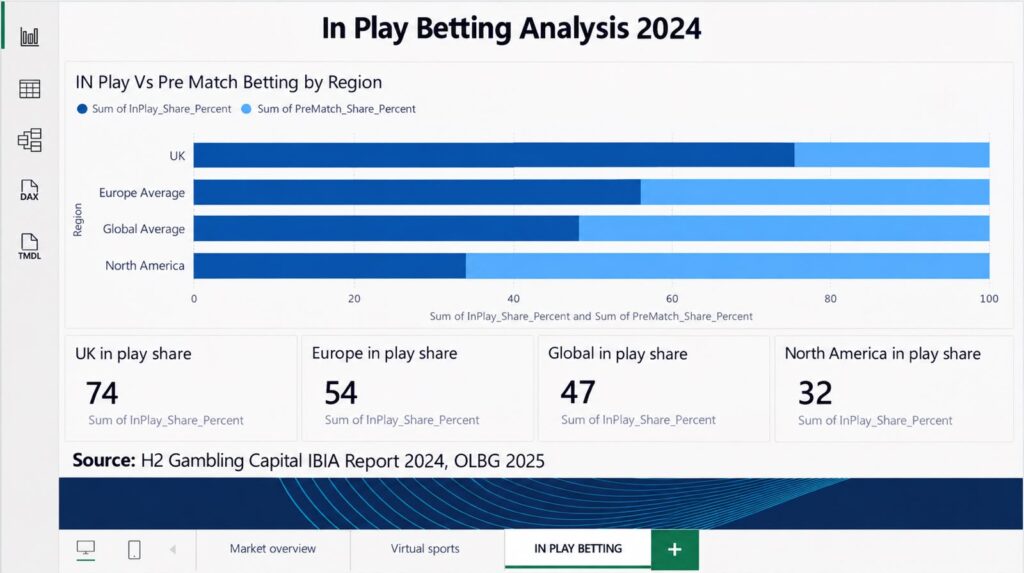
H2 Gambling Capital data reported by IBIA puts in-play at 47% of global online sports betting GGR in 2024.
The same source expects the figure to reach 51% by 2028.
The UK has a much higher level of in-play betting than the global figure.
This shows how important live betting has become in mature betting markets.
The difference between pre-match and in-play is mainly about timing.
A football match, tennis match or cricket game creates new information as it happens. That information can change the available betting markets and prices.
Traditional Sports
The growth of fast betting does not mean traditional sports are becoming irrelevant.
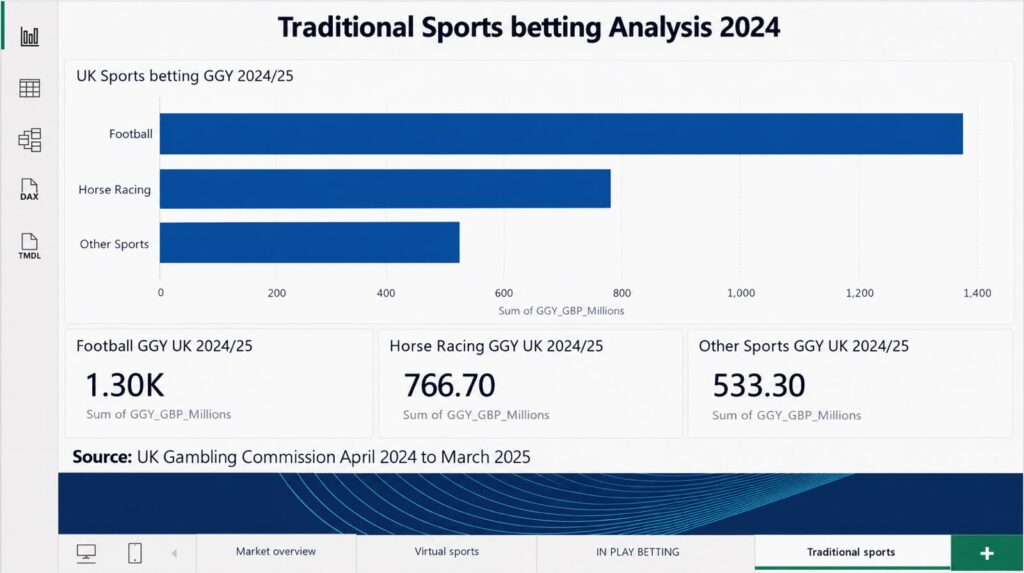
UK Gambling Commission data for April 2024 to March 2025 shows that remote betting generated around £2.6 billion in GGY.
Football generated £1.3 billion.
Horse racing generated £766.7 million.
Other sports generated £533.3 million.
Football alone generated more GGY than horse racing and other sports combined.
The numbers show how important established sports remain to the betting market.
Global Market
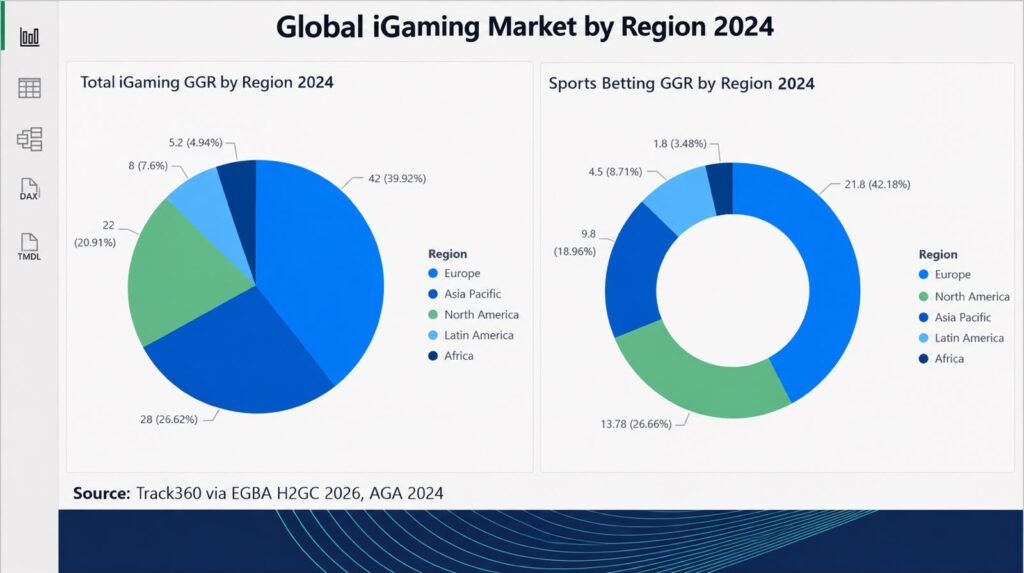
The final dashboard page looks at the wider iGaming market.
The data covers Europe, North America, Asia Pacific, Latin America and Africa.
The size of the sports betting market also differs between regions.
Sports betting makes up a larger share of iGaming activity in some regions than others.
This is useful when looking at fast betting products because market conditions are different from one region to another.
What the Data Shows
The dashboard highlights three main points.
Traditional sports remains the largest market in the data.
In-play betting already represents a large share of online sports betting in several markets.
Virtual sports is smaller than traditional sports but has a higher projected growth rate in the market estimates used here.
These products are not necessarily competing for the same type of betting activity.
Traditional sports depends on scheduled sporting events.
In-play betting adds betting opportunities while those events are taking place.
Virtual sports provides scheduled or on-demand events without depending on real-world sporting fixtures.
Building the Dashboard
The main challenge with this project was not creating the charts.
It was working with data from different sources.
Market size, GGR, GGY, growth rates and regional percentages are different measurements.
Putting them into one Power BI report does not make them directly comparable.
That was an important part of the analysis.
The dashboard is designed to show each figure with its relevant market, period and source rather than treating all the numbers as one dataset.
Final Takeaway
Fast betting and traditional sports are developing in different ways.
Traditional sports still has the largest market size.
In-play betting has become an important part of sports betting.
Virtual sports provides another betting format that does not depend on real sporting events.
The purpose of this project was not to decide which category is better.
It was to put the available data into one Power BI dashboard and make the differences easier to see.
That is what the data shows.
What do you think? Which betting category has the most room to grow?
Inder Pant | iGamingMonk
This analysis uses publicly available industry data from multiple sources.
Methodology
The sources use different definitions, periods and research methodologies. The figures have therefore been kept as separate market indicators and have not been combined into one total market figure.
Sources
UK Gambling Commission
IBIA and H2 Gambling Capital
Grand View Research
SkyQuest
Market.us